


Tower 4T4 Mass Loaded Transmission Line Speaker Build Manual
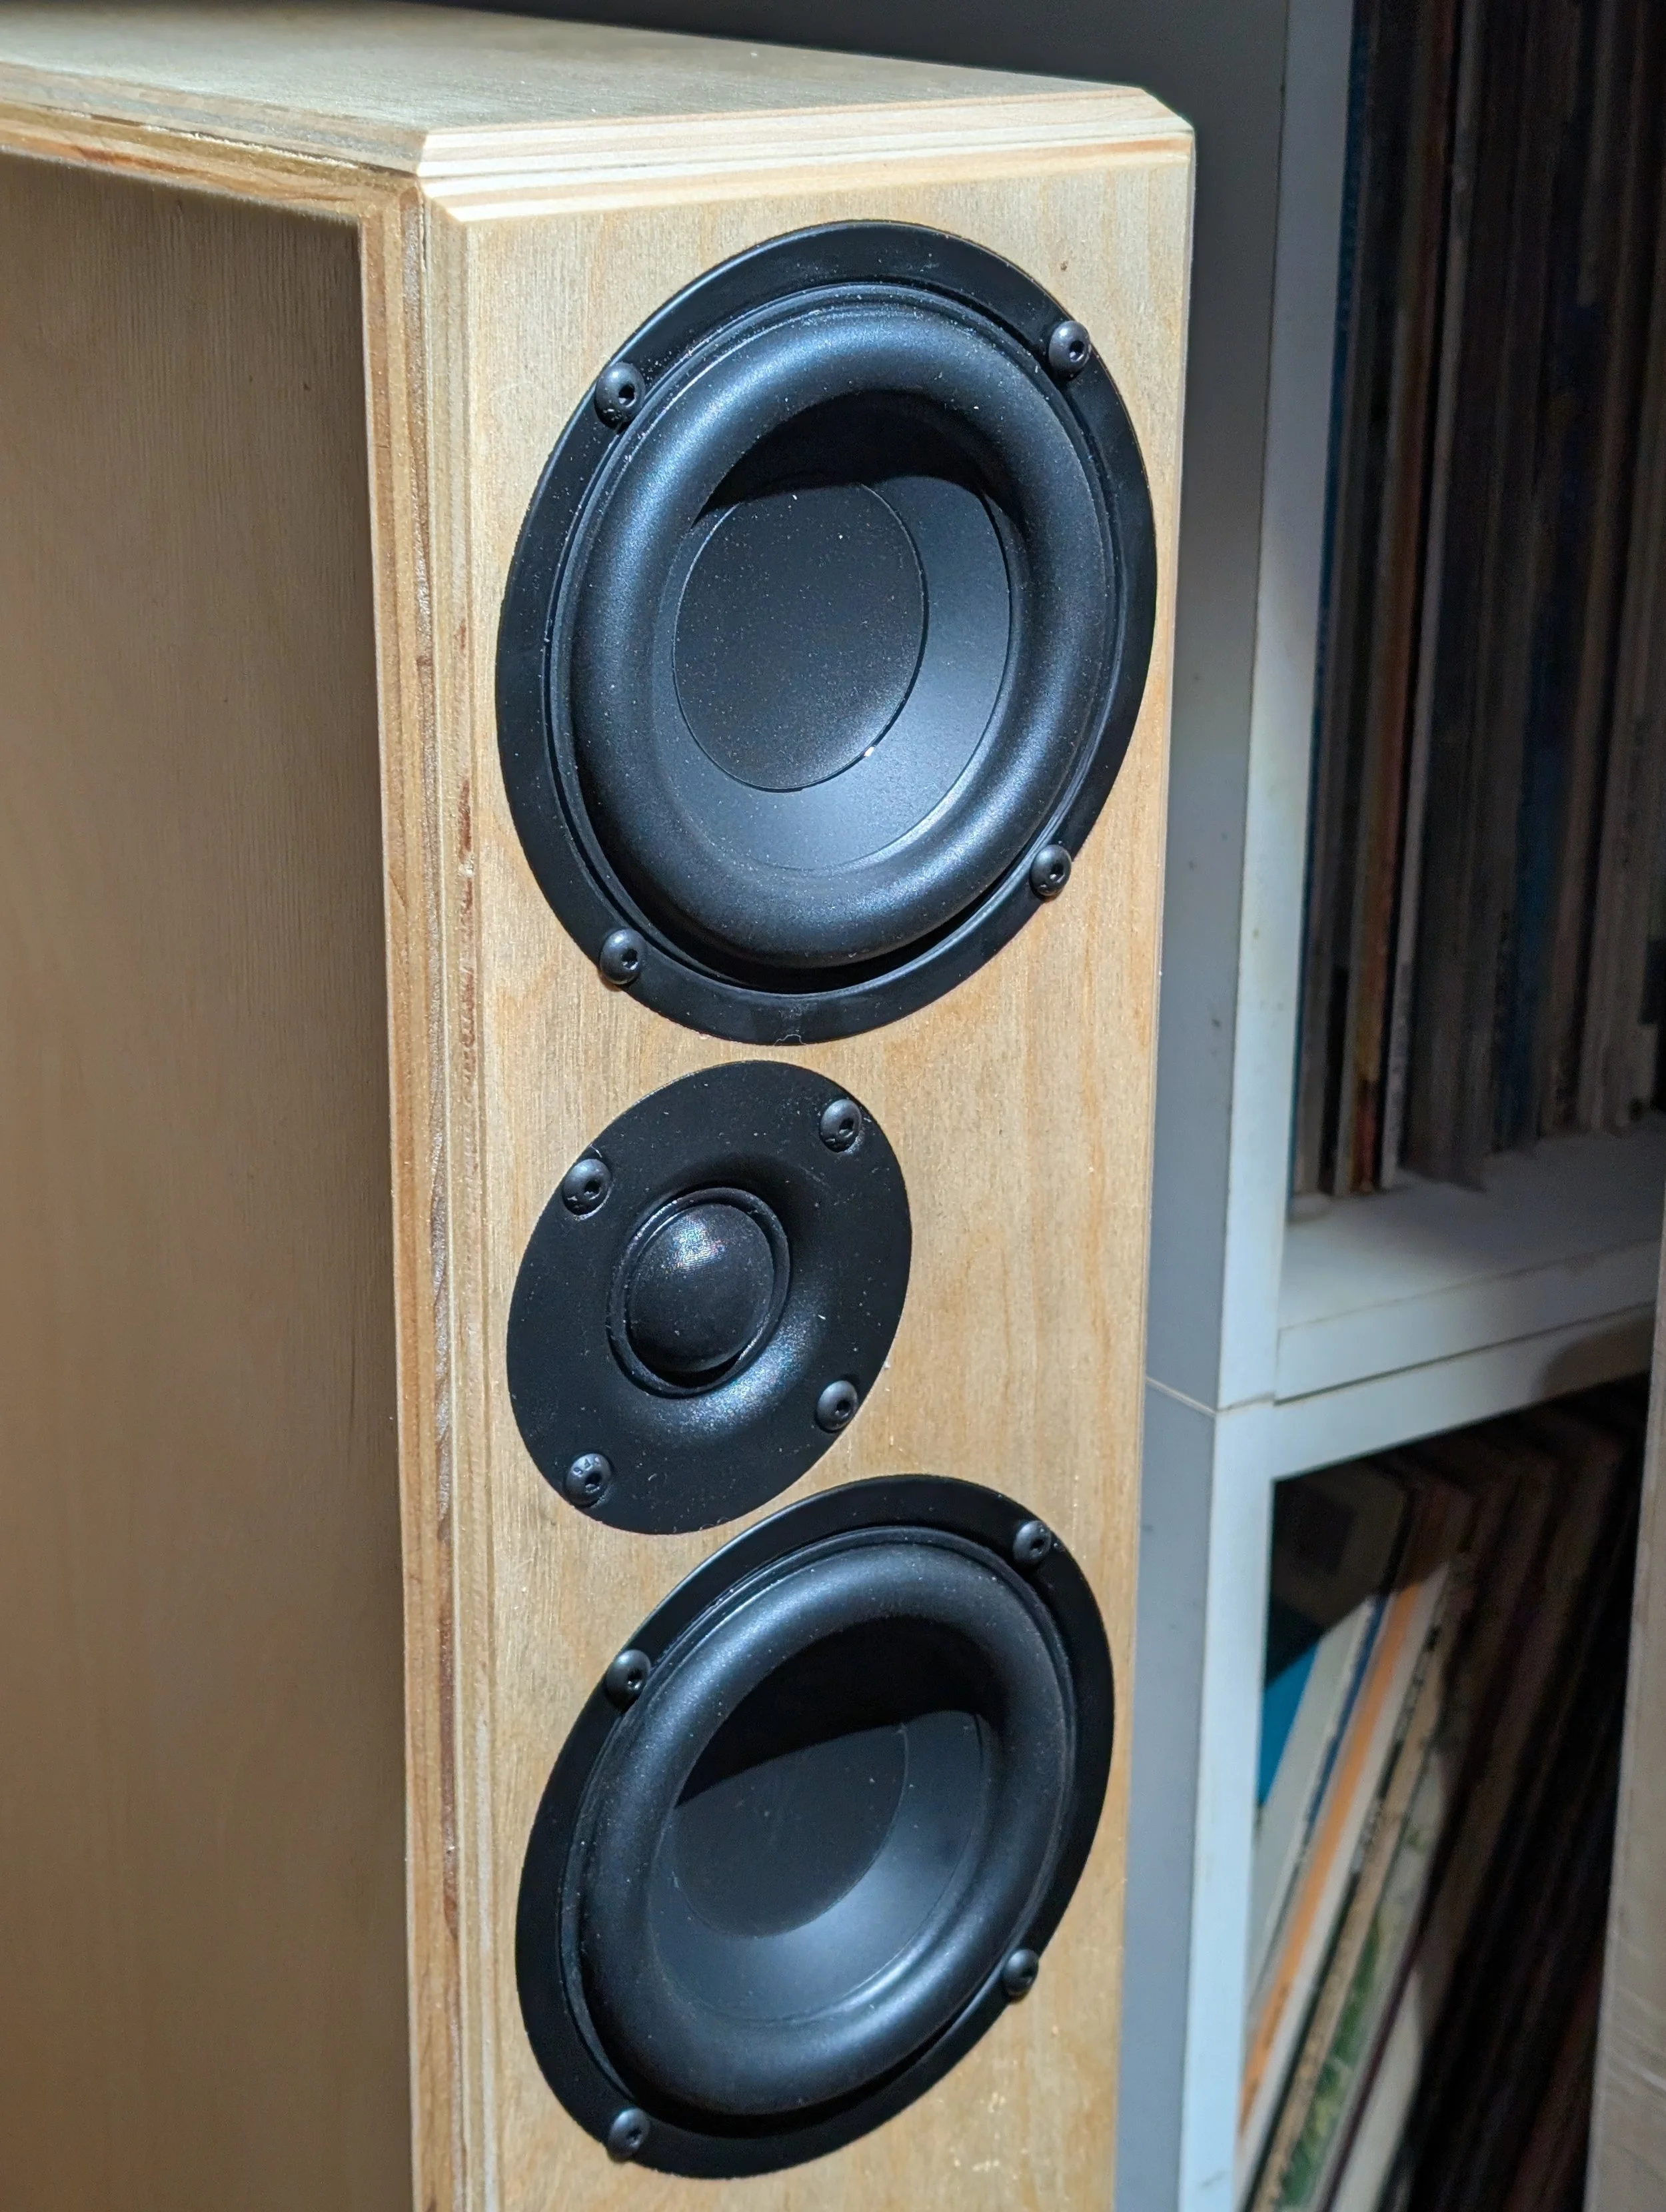
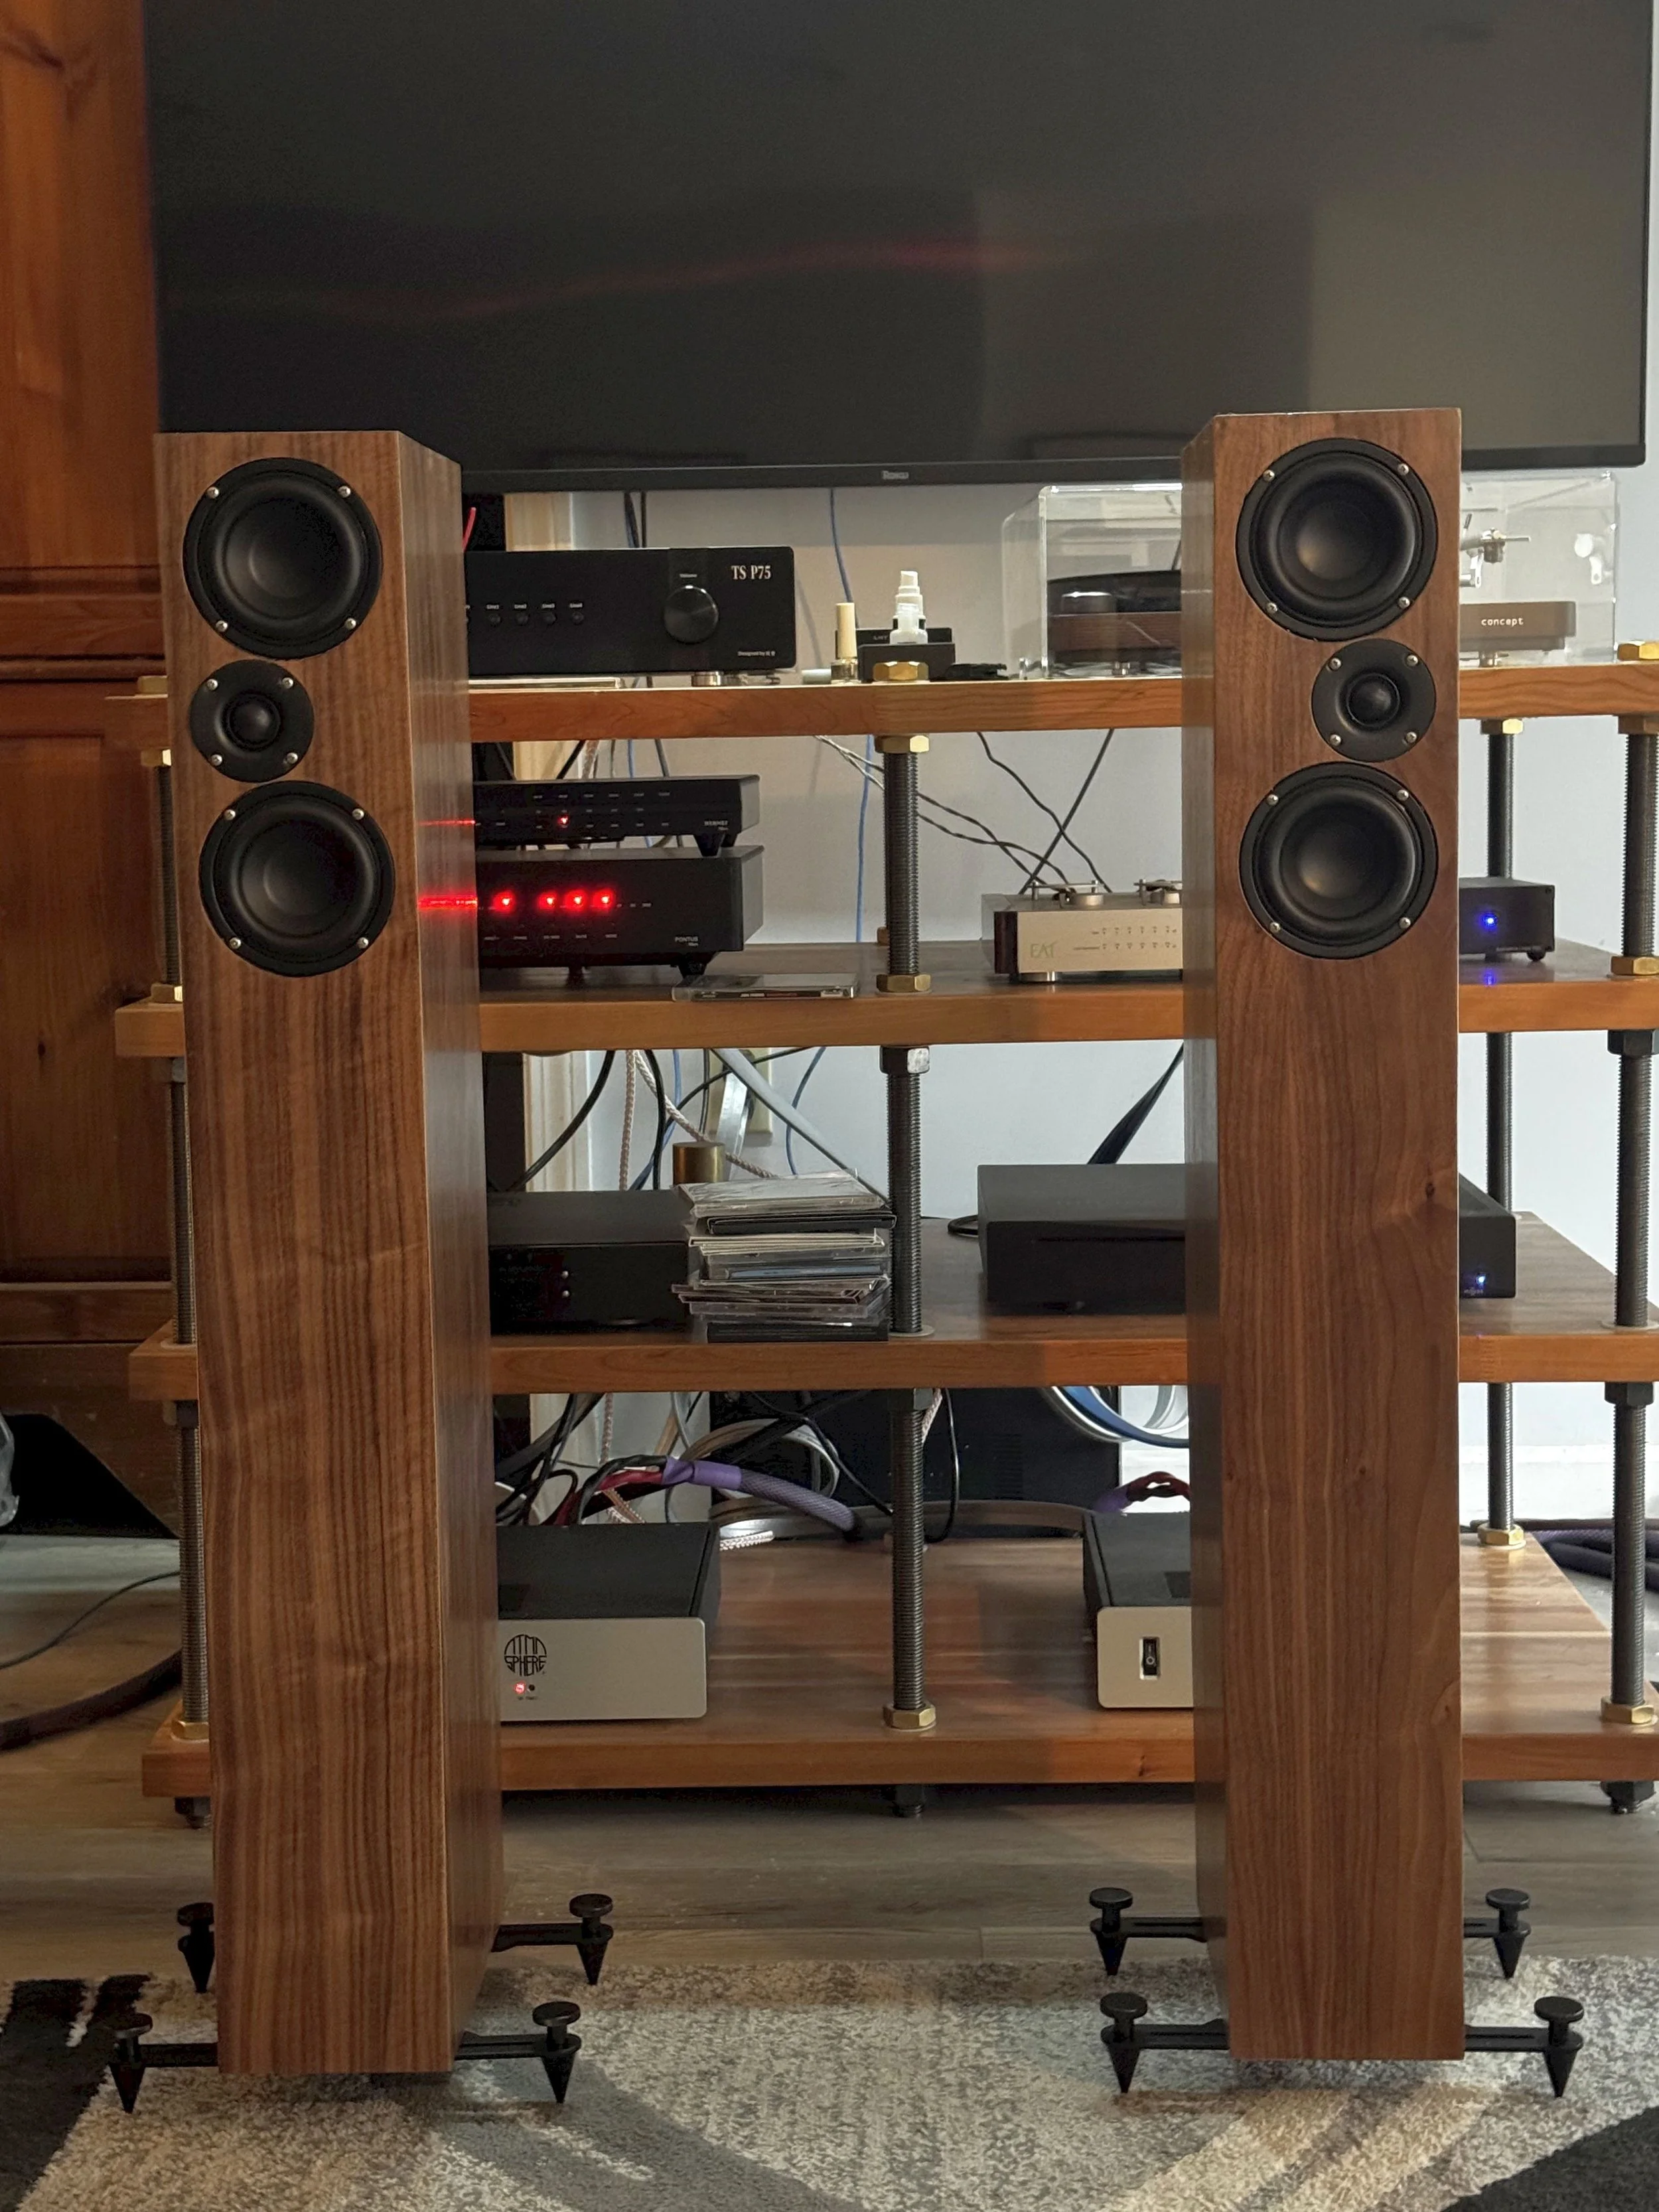
The Tower 4T4 is a slim MTM (mid-tweeter-mid) floor standing speaker, with the two 4” paper cone midwoofer drivers in a mass loaded transmission line cabinet, that is tuned to 25Hz. The 1” soft dome tweeter is offset to minimize diffraction - the front baffle is just 5 9/16” (141.3mm) wide for excellent imaging and soundstage. They are a mirrored pair - typically the tweeter is on the inside edge. The Dayton Audio midwoofers and SB Acoustics tweeter use a series crossover. The Tower 4T4 is tuned to the same fundamental frequency as the Tower 6, but each 4” driver has an Mms (moving mass) of just 9.9 grams vs the 13.8 grams of the 6” - so the midrange quality is even better. They use the same excellent tweeter. In-room sensitivity measured @ 2.83V @ 1 meter on axis is 87dB SPL. The Tower 4T4 has a nominal impedance of 8-10 ohms (minimum of 7 ohms), making it a good match with virtually any amplifier.
Mass loaded transmission line speakers have the best bass quality of any speaker I have heard in my nearly 4 decades of music listening. They also have wonderful “unboxy” midrange, and have a spacious soundstage; if it is there in the recording. The midrange of transmission line speakers is also much more open than conventional designs; and may rival open baffle designs.
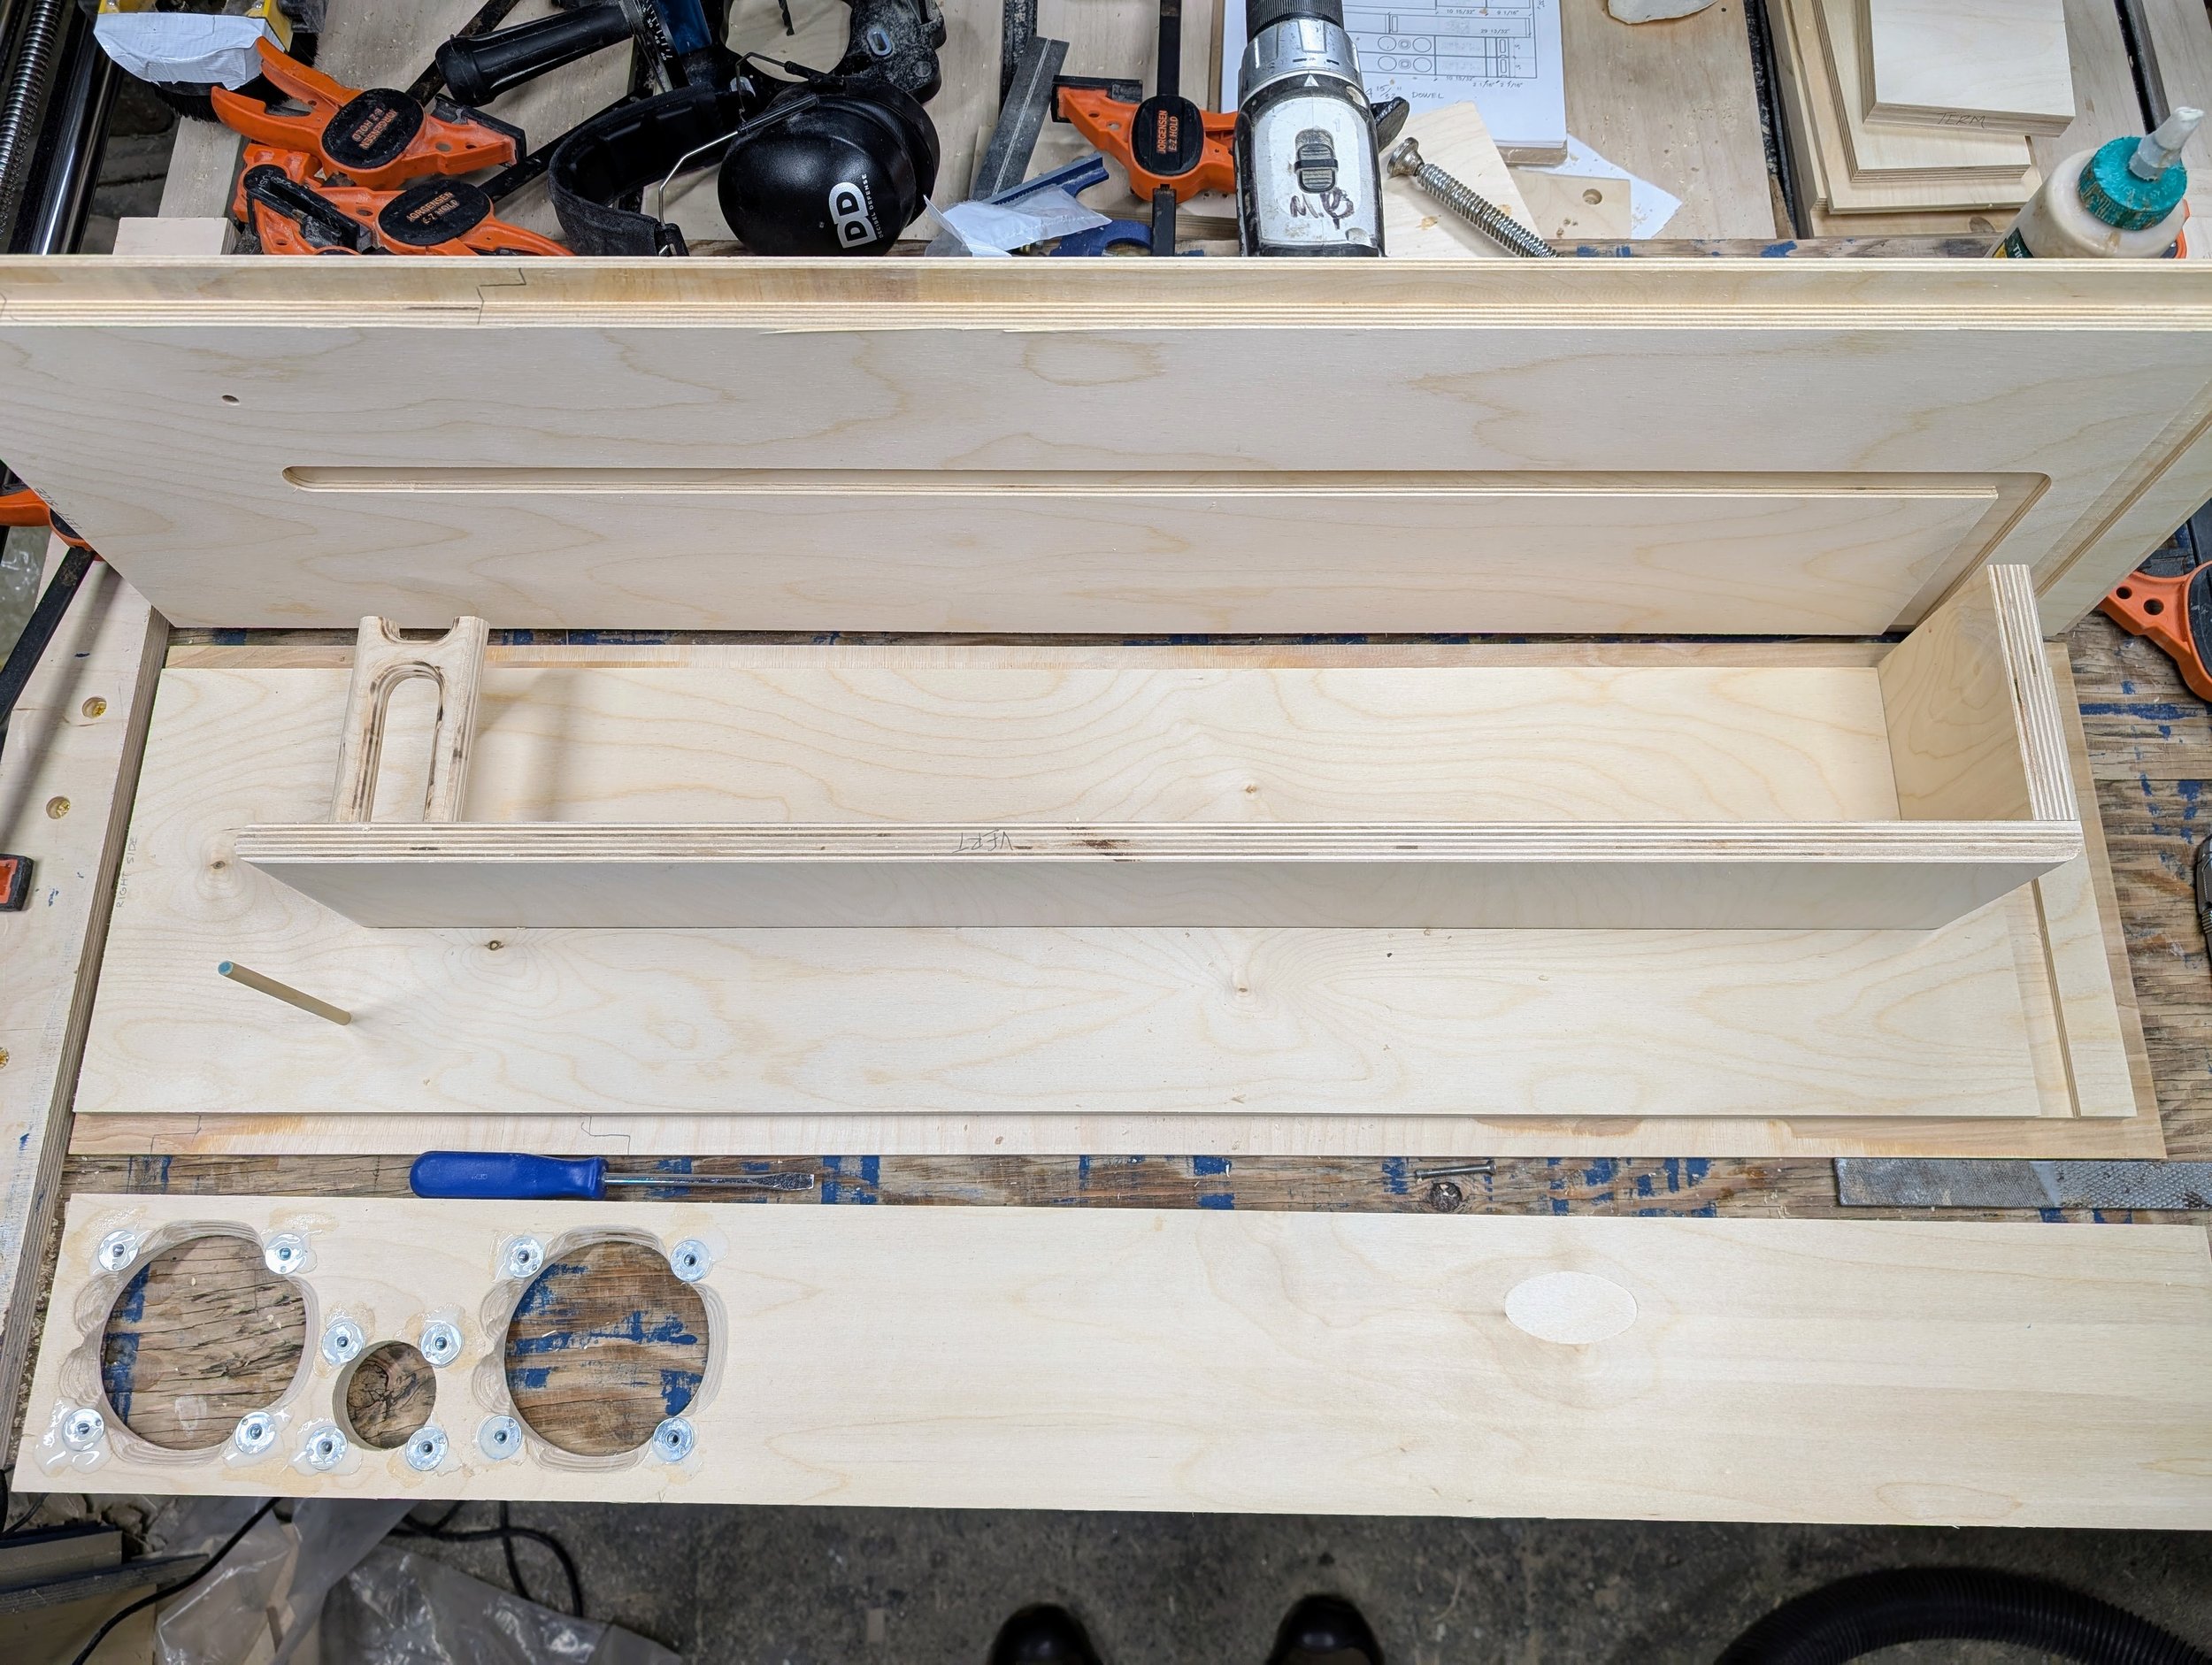
The cabinet is 5.6”W x 39.4”H x 10.5”D / 142mm x 1000mm x 266mm (not including outrigger feet) and is made with 18mm thick material - either Baltic birch or MDF. Each finished speaker built with the Baltic birch flat pack weigh a bit less than 30.8 lbs / 14kg (including the outrigger feet). The corners are designed to have a 12mm x 12mm chamfer; but the MDF can be left square, if you choose. The chamfer also has an acoustic function of slightly reducing edge diffraction. I can provide CAD files to make CNC cut files - the build manual includes drawings of the straight cut, and also the CNC version of the panels. It can be built with a table saw and plunge router, and/or with a CNC machine.
A strong benefit of a “folded” transmission line design is the internal baffles not only form the specific volumes and dimensions required for the correct tuning for the midwoofers - they also form asymmetrical bracing for the cabinet. Less obvious is the fact that the internal air pressure in a TL design is lower than an equivalent sealed, or even a ported design. This greatly reduces the panel resonances - and this is possibly why the midrange and bass are more open and clearer. The woofer has less of an “air spring” behind it, so it is more closely reproducing the music in the recording.
We have also spent a lot of time designing and refining crossover designs - the current version is V2.0. It is a series crossover design, with a 4th order filter on the tweeter, and a 2nd order and a step filter on the midwoofers. The crossover frequency is ~1.6kHz, and there is a Zobel filter for the midwoofers. A series crossover diverts the signal that is filtered out for one driver, and diverts it to the other driver. And so a series crossover can be slightly more efficient, and they tend to have a smoother more even impedance; which can make them better for use with tube amplifiers.
A transmission line speaker cabinet is a tuned “column” of air behind the driver - it has lower distortion and greater bass extension that conventional sealed or ported designs. I used a program called Hornresp (short for Horn Response), and carefully matched the computer acoustic model to the cabinet design, using DataCAD.
The total cost of the four midwoofers and a pair of tweeters is about $150 - the midwoofers are Dayton Audio units from Parts Express; and the tweeter is made by SB Acoustics and is sold by Madisound. The crossover uses all air core inductor coils, with larger gauge coils for a lower DCR. This is important for the best possible bass quality. We highly recommend bypass capacitors, that open up the soundstage with clear layered and extended treble. The benefits of high quality crossover components cannot be overstated. The build manual includes clickable links for 3 options - “good, better, best” lists of crossover parts quality.
The Tower 4T4 speakers are 8-10 ohm nominal impedance - and has a minimum of about 7.0 ohms @~228Hz. I am using the amazing AkitikA GT-104 amp - it is rated at 60W/ch @ 4 ohms and ~35W/ch @ 8 ohms - it barely gets warm even after long listening sessions. Any amp that is rated for ~8 ohm speakers will probably work very well with the Tower 4T4 speakers.
The current manual is V2.0 - if you purchased it already and have an earlier version - email us and we will send you the current version. It includes drawings in inches and in millimeters, for straight cut panels, and rabbeted & grooved / CNC version of the panels. I can provide the CAD files for these, if you want to build it this way. It includes the recommended option for an external crossover box, with a 2-piece back panel.
*******
We are very happy to announce that you are now able to order assembled crossovers for the Tower 4T4! E-Zee’s Speaker Solutions has “good/better/best” parts lists that are similar to our build manual - all air core inductor coils, metalized film capacitors, and very low/non-inductive resistors. If you want to build one of our Tower 4T4 speakers - but building the crossover was holding you back - then you have this option. Visit their website, and email them for pricing. <ezeecrossovers@gmail.com>
The Tower 4T4 is a slim MTM (mid-tweeter-mid) floor standing speaker, with the two 4” paper cone midwoofer drivers in a mass loaded transmission line cabinet, that is tuned to 25Hz. The 1” soft dome tweeter is offset to minimize diffraction - the front baffle is just 5 9/16” (141.3mm) wide for excellent imaging and soundstage. They are a mirrored pair - typically the tweeter is on the inside edge. The Dayton Audio midwoofers and SB Acoustics tweeter use a series crossover. The Tower 4T4 is tuned to the same fundamental frequency as the Tower 6, but each 4” driver has an Mms (moving mass) of just 9.9 grams vs the 13.8 grams of the 6” - so the midrange quality is even better. They use the same excellent tweeter. In-room sensitivity measured @ 2.83V @ 1 meter on axis is 87dB SPL. The Tower 4T4 has a nominal impedance of 8-10 ohms (minimum of 7 ohms), making it a good match with virtually any amplifier.
Mass loaded transmission line speakers have the best bass quality of any speaker I have heard in my nearly 4 decades of music listening. They also have wonderful “unboxy” midrange, and have a spacious soundstage; if it is there in the recording. The midrange of transmission line speakers is also much more open than conventional designs; and may rival open baffle designs.
The cabinet is 5.6”W x 39.4”H x 10.5”D / 142mm x 1000mm x 266mm (not including outrigger feet) and is made with 18mm thick material - either Baltic birch or MDF. Each finished speaker built with the Baltic birch flat pack weigh a bit less than 30.8 lbs / 14kg (including the outrigger feet). The corners are designed to have a 12mm x 12mm chamfer; but the MDF can be left square, if you choose. The chamfer also has an acoustic function of slightly reducing edge diffraction. I can provide CAD files to make CNC cut files - the build manual includes drawings of the straight cut, and also the CNC version of the panels. It can be built with a table saw and plunge router, and/or with a CNC machine.
A strong benefit of a “folded” transmission line design is the internal baffles not only form the specific volumes and dimensions required for the correct tuning for the midwoofers - they also form asymmetrical bracing for the cabinet. Less obvious is the fact that the internal air pressure in a TL design is lower than an equivalent sealed, or even a ported design. This greatly reduces the panel resonances - and this is possibly why the midrange and bass are more open and clearer. The woofer has less of an “air spring” behind it, so it is more closely reproducing the music in the recording.
We have also spent a lot of time designing and refining crossover designs - the current version is V2.0. It is a series crossover design, with a 4th order filter on the tweeter, and a 2nd order and a step filter on the midwoofers. The crossover frequency is ~1.6kHz, and there is a Zobel filter for the midwoofers. A series crossover diverts the signal that is filtered out for one driver, and diverts it to the other driver. And so a series crossover can be slightly more efficient, and they tend to have a smoother more even impedance; which can make them better for use with tube amplifiers.
A transmission line speaker cabinet is a tuned “column” of air behind the driver - it has lower distortion and greater bass extension that conventional sealed or ported designs. I used a program called Hornresp (short for Horn Response), and carefully matched the computer acoustic model to the cabinet design, using DataCAD.
The total cost of the four midwoofers and a pair of tweeters is about $150 - the midwoofers are Dayton Audio units from Parts Express; and the tweeter is made by SB Acoustics and is sold by Madisound. The crossover uses all air core inductor coils, with larger gauge coils for a lower DCR. This is important for the best possible bass quality. We highly recommend bypass capacitors, that open up the soundstage with clear layered and extended treble. The benefits of high quality crossover components cannot be overstated. The build manual includes clickable links for 3 options - “good, better, best” lists of crossover parts quality.
The Tower 4T4 speakers are 8-10 ohm nominal impedance - and has a minimum of about 7.0 ohms @~228Hz. I am using the amazing AkitikA GT-104 amp - it is rated at 60W/ch @ 4 ohms and ~35W/ch @ 8 ohms - it barely gets warm even after long listening sessions. Any amp that is rated for ~8 ohm speakers will probably work very well with the Tower 4T4 speakers.
The current manual is V2.0 - if you purchased it already and have an earlier version - email us and we will send you the current version. It includes drawings in inches and in millimeters, for straight cut panels, and rabbeted & grooved / CNC version of the panels. I can provide the CAD files for these, if you want to build it this way. It includes the recommended option for an external crossover box, with a 2-piece back panel.
*******
We are very happy to announce that you are now able to order assembled crossovers for the Tower 4T4! E-Zee’s Speaker Solutions has “good/better/best” parts lists that are similar to our build manual - all air core inductor coils, metalized film capacitors, and very low/non-inductive resistors. If you want to build one of our Tower 4T4 speakers - but building the crossover was holding you back - then you have this option. Visit their website, and email them for pricing. <ezeecrossovers@gmail.com>
The graphs are from XSim, which uses the measured response of individual drivers, along with their measured impedance, to model the crossover. The midwoofer response (green) is for one of the drivers - the two together sum together to be the speaker’s response (blue) above it.